You can create the most powerful data visualization solution in Power BI desktop by using measures. It is used to apply the calculation on your data as you know with your report. It is the use to perform the arithmetic operation for any visual report. It has lots of function which can apply any column. The measures are created and used in graph View or Data View in Power Bi desktop. Measures you create yourself appear in the Fields list with a calculator icon.
Now ahead we describe measure in following steps:
• What is the measure?
• How to use measure within another measure
• How to apply to measure filter
Measure:
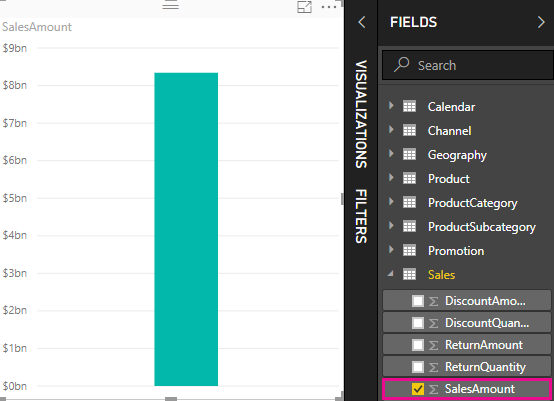
In Power desktop, it creates insights into your data with measure field. This is used some of the most common data analysis. When you get data and import any data file in Power BI. Then you create a visual report and apply different charts. After creating a chart you select any visual report it shows two fields like Visualization and field.

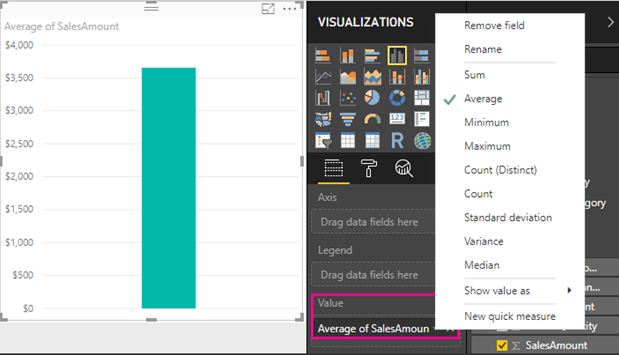
Now you can implement many operations according to requirement when you select on any visual report and go to visualization field then see value field after that right click on value field Now you get the list of operations like Remove field, Rename, Sum, average, minimum, maximum, distinct count, count, standard deviation, Variance, Median, So value as and new quick measure. You can perform all the operation accordingly.
Example:
We have a dataset of sales and we have to make a graph and apply measure technique. You can see in below screenshot like select a report and apply the count function using measure technique if we need to change any another operation we can do change using the same tab. If we need to apply two or more function in one time and one graph then the first measure we can apply using this field and another we can apply using DAX syntax. DAX syntax uses many of the same function operations or excel formulas. However, DAX syntax is designed to work with relation and apply more dynamic operation as you are implementing in your report. It has over 200 DAX syntax that is do anything simple aggregation like count, average, and sum to most complex filtering function and statistical.
Use measure with another measure:
Once you need to create a measure you can use to another measure with this measure. It is not possible to direct process from the field but you can apply from DAX function. When you have to create one measure on any visual graph and you want to create another measure that selects the report and go to DAX index and create another variable of a different measure. When you create another variable then it can implement another measure also.
Apply measure filter:
When you have created a visual report in Power BI then many times we need to apply lots of filter according to requirement. You select any visual report and got to the visualization tab. Then you got two fields like Page level filter, Report level filter, and visual level filter. These are works in a different way. When we create a page level filter, If we implement any filter in page field the basis of any column then It’s work on the whole page. If we implement any filter in report field like greater then, less then, contains and is equal to etc. Then it works on a particular report. If you apply a visual level filter then need to select any visual graph and apply filter according to requirement. Then it’s work only a particular graph.
This is the basic process of visualization. You can also apply all filter in one time. It is part of the measure also. When we import new data and create a report if you need to create two or more operation in one time then you can apply in one report. Other one solution that is we need to apply two operations in the report then we can create two graphs also and apply the measure as respectively.
Conclusion:
A measure is a technique that is used to perform any operation on any column of datasets. It is easy to perform and easy to understand. When we get new data set in the Power BI desktop then we create any type of graph then we got a new requirement and now need to change two or more things in the graph. We can update the graph using measure field that is available in the visualization field and we can apply filter also. We can apply to require filter using visualization field. It has many types of filter like the page, report and visual level filter. We have a great way to quickly measure and also a good way to learn DAX function.